What glucose ranges does the Stelo trend graph show?
Note: The information below applies to Stelo app version 3.3 and later. For the best experience and newest features, make sure you update your Stelo app.
Stelo can display a glucose range of 55 mg/dL to 350 mg/dL on the trend graph. This gives you a comprehensive view of your glucose patterns and helps you better understand how your daily habits may affect your glucose. The trend graph also adjusts to your data, making it easier to see changes and patterns over time.
By default, Stelo displays a trend graph range of 55 mg/dL to 200 mg/dL. If you'd like to increase your graph height, you can customize your graph in Settings>Graph settings.
There are two ways to adjust your graph:
Dynamic Graph Height
Turn on Dynamic Graph Height to automatically adjust the graph based on your glucose data, helping keep more of your glucose story in view.
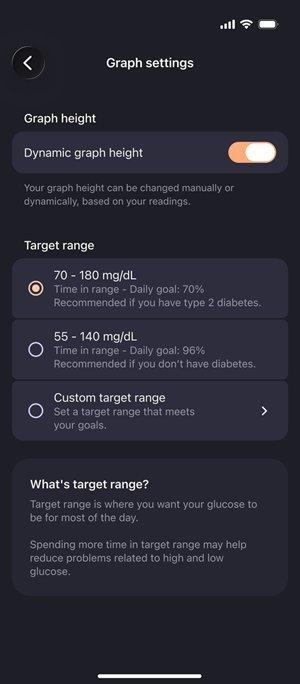
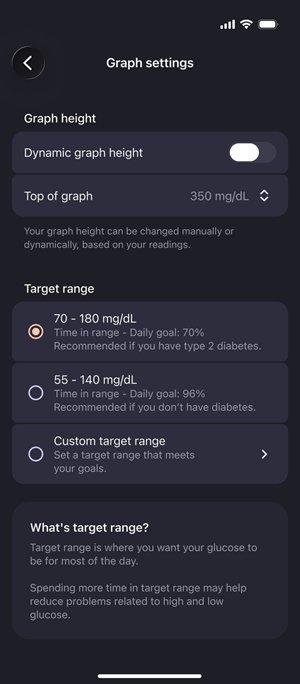
Manual Graph Height
Prefer a more consistent view? Turn off Dynamic Graph Height and choose the top value for your trend graph, up to 350 mg/dL. This can help you customize your view to your preferences and health goals.
MAT-6743
Related articles
What glucose ranges does the Stelo trend graph show?
Track glucose from 55-350 mg/dL in the Stelo app and uncover patterns with an adaptive trend graph that adjusts to your data.
How does my doctor obtain a Clarity Clinic Share Code?
Before connecting your Stelo biosensor to Clarity, call and ask your healthcare provider if they're using Dexcom Clarity and obtain their Clarity Share Code.
How can I share my Stelo biosensor data with my doctor?
Connect Stelo to Clarity to easily share your Stelo glucose biosensor data with your healthcare provider. Follow these steps to connect Stelo to Clarity.
What is Dexcom Clarity for Stelo?
Dexcom Clarity allows you to access your Stelo glucose data for up to 90 days, see glucose trends, and share your data with your healthcare provider.